Over the last years, the city of Hamburg (Germany) has put significant work into their Urban Data Platform and the geo-portal, improving the accessibility of various data sources.
In particular, the Traffic Lights Data Hamburg beta API provides access to real-time signal data of traffic-light systems for a large number of intersections in the city center.
Green-light optimized speed advisory
The idea of green-light optimized speed advisory (“GLOSA”) is to reduce unnecessary stops and accelerations by calculating reasonable movement speeds based on expected future green-light periods of upcoming traffic-lights.
Examples:
- Gevas launched their app traffic pilot which is available i.a. in Duesseldorf, Frankfurt, Salzburg and Kassel
- Audi provides a GLOSA traffic assistant for their cars in selected cities (i.a. Ingolstadt, Duesseldorf, and New York (US))
Available traffic-lights data in Hamburg
The geo-portal is an interactive map which can visualize some of the data made available by the city of Hamburg.
The screenshot below shows real-time traffic-light data of the intersection Fruchtallee / Doormannsweg:
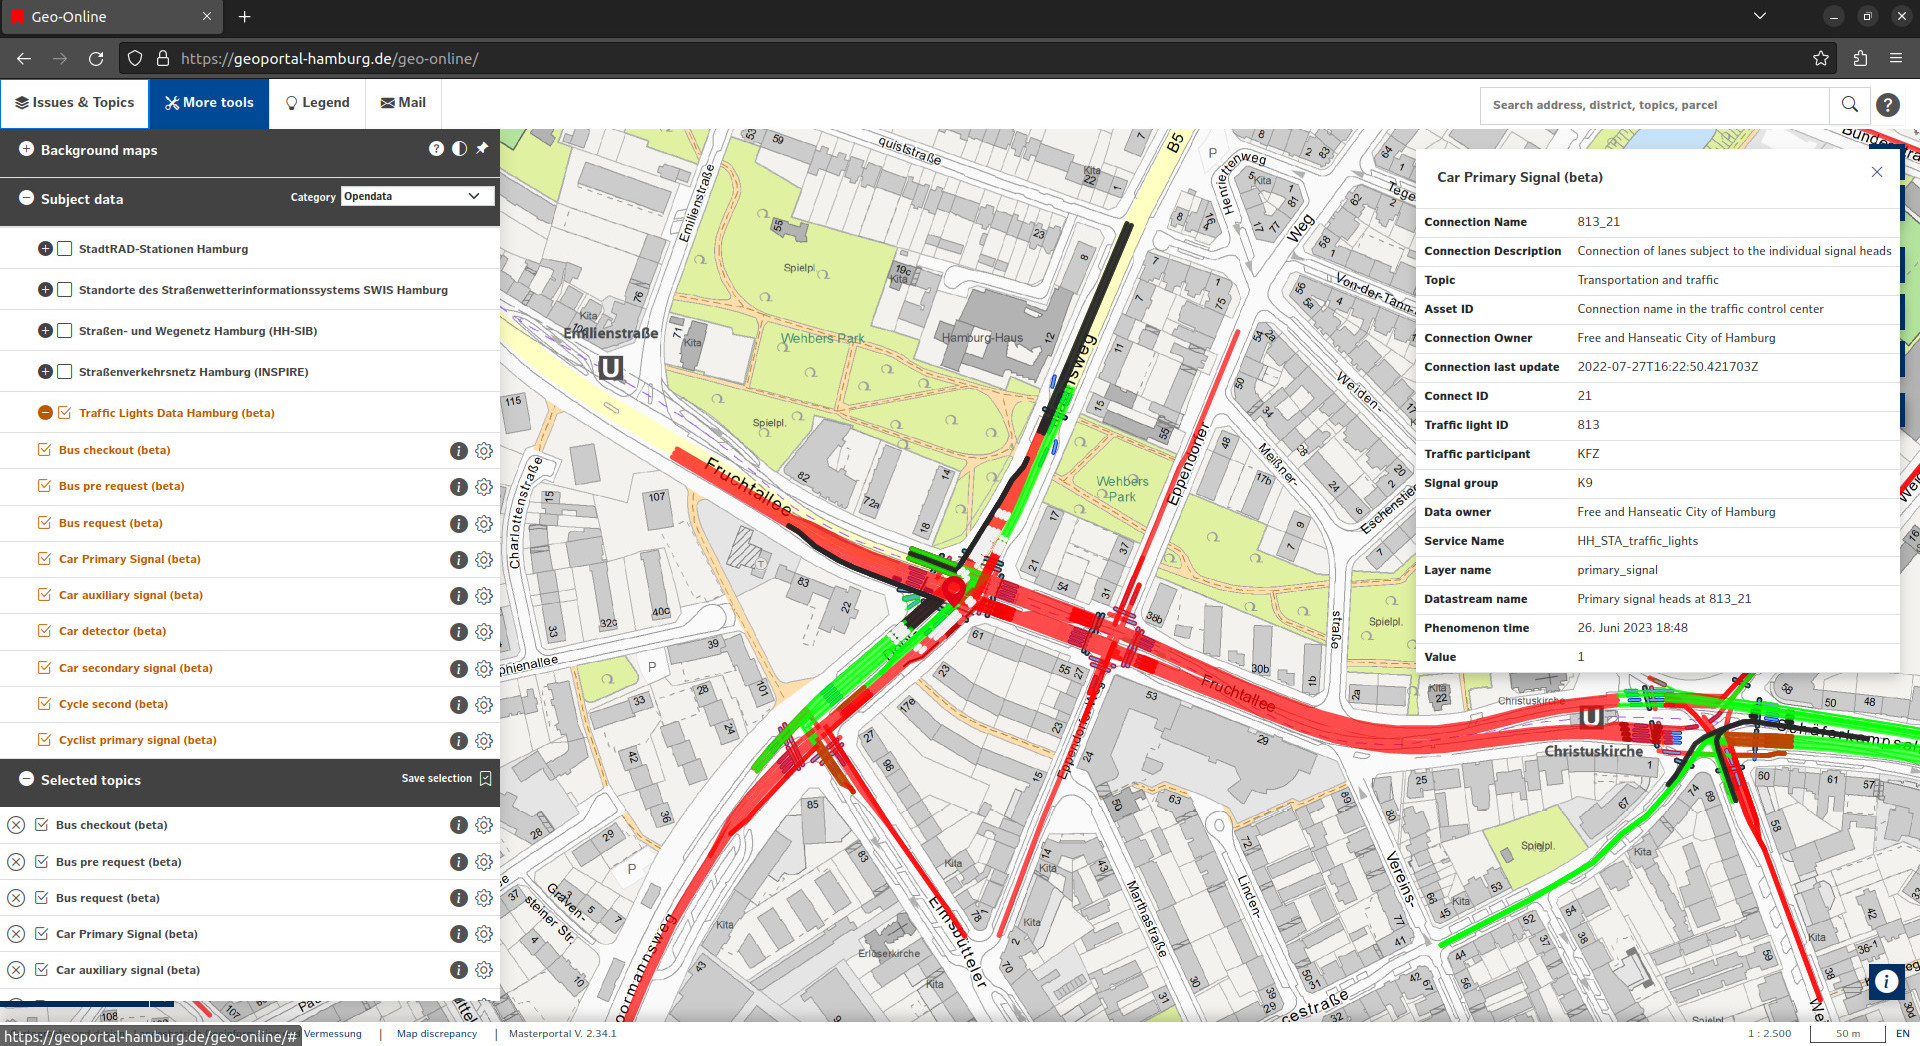
Colors indicate the current signal of traffic-lights of different lanes.
Corresponding data is provided for about 800 of 1770 traffic-lights in Hamburg:
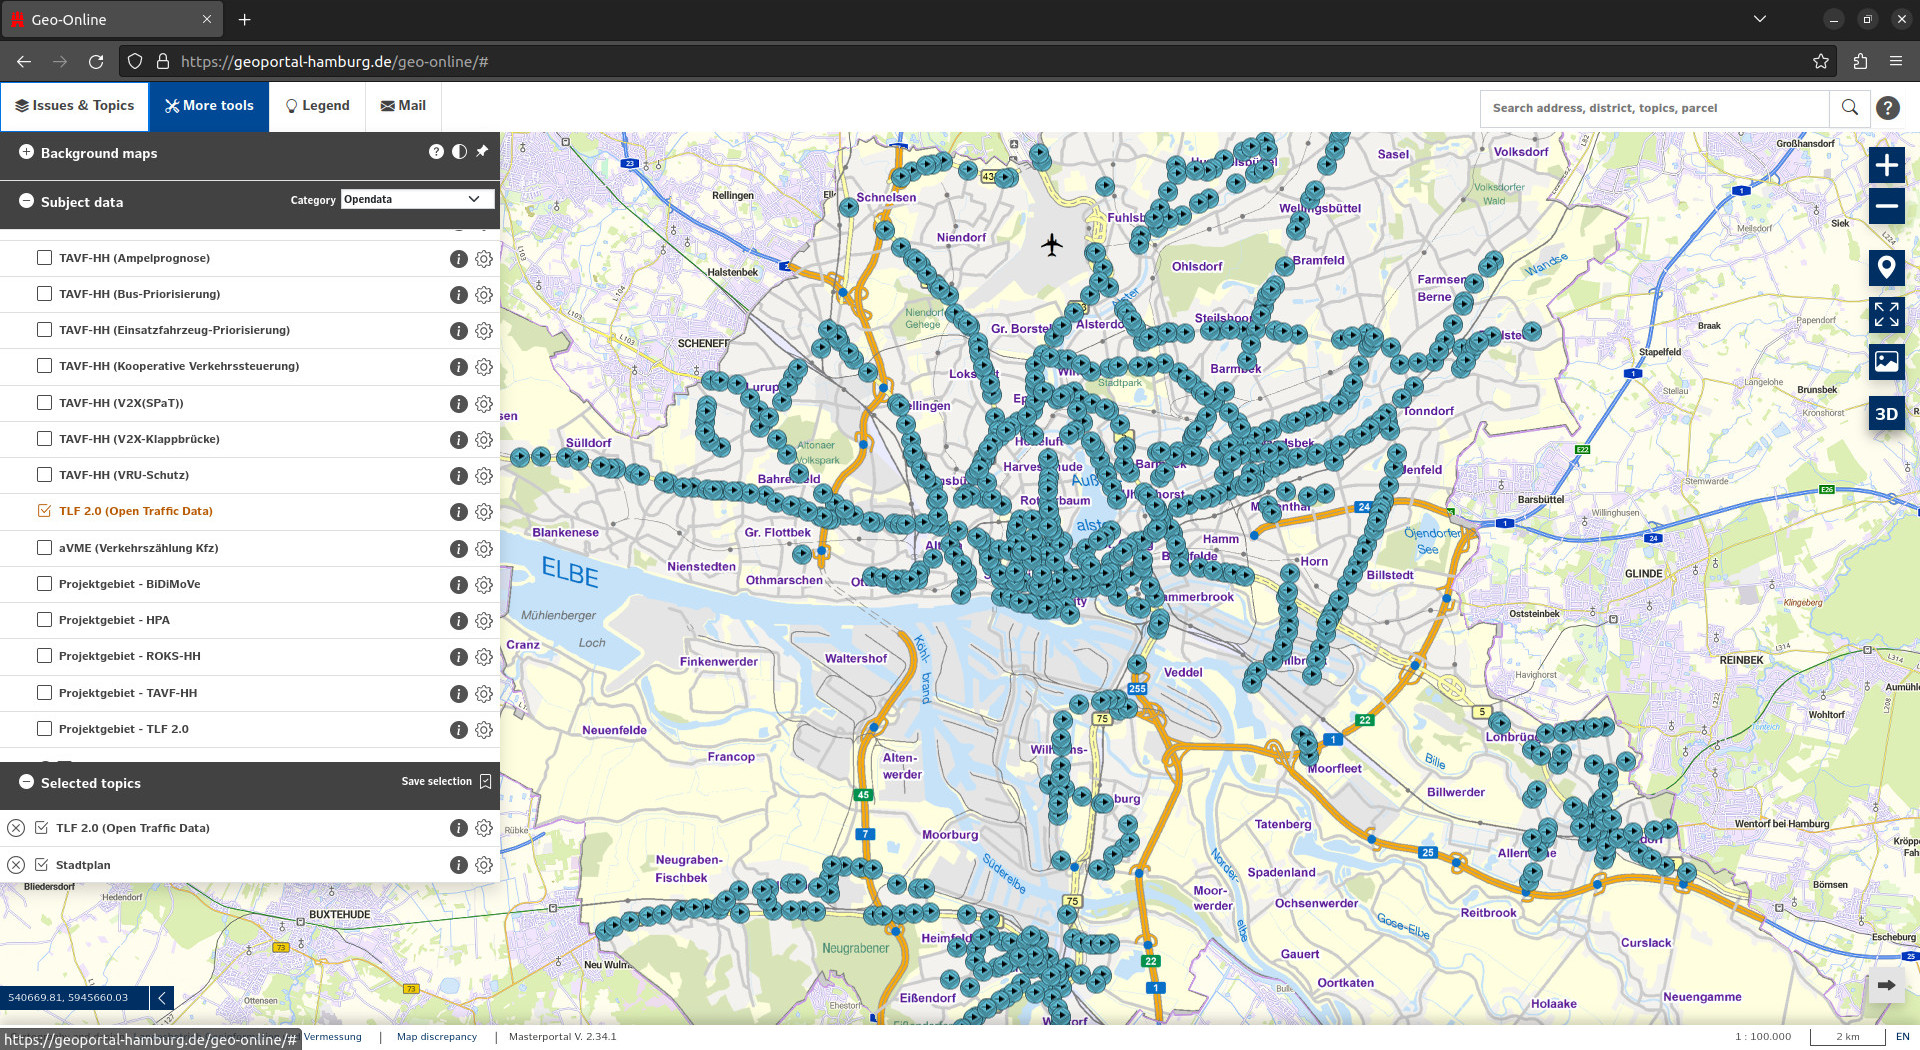
The data is made available on https://tld.iot.hamburg.de/v1.1 via the standard OGC SensorThings API which is described in detail e.g. here (usage guide).
This paper gives an overview on the system architecture and underlying infrastructure.
The map below shows a sample cycling route through the city as well as markers for all traffic-lights for which real-time data is currently available:
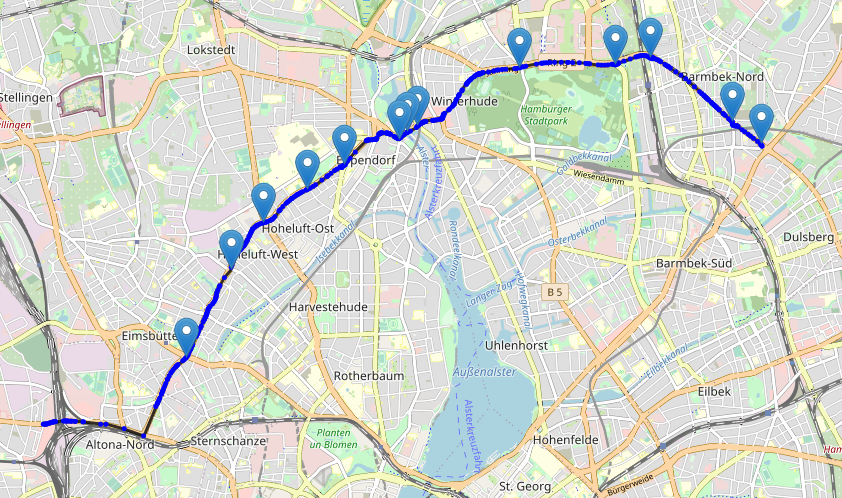
Overall, 13 out of 21 traffic-lights on the route provide real-time data (some are currently disabled due to ongoing construction work, and some may just be too small to be prioritized when planning corresponding IoT equipment).
To give an impression of provided traffic-light real-time data, the following bokeh-chart shows some historical data for the relevant primary signal (south -> north) of the above-mentioned intersection Fruchtallee / Doormannsweg (the most westward on the route, with ID 813_19, Datastream-ID 50850), on a typical morning (Friday, 19.05.2023, 6:00-8:00 UTC):
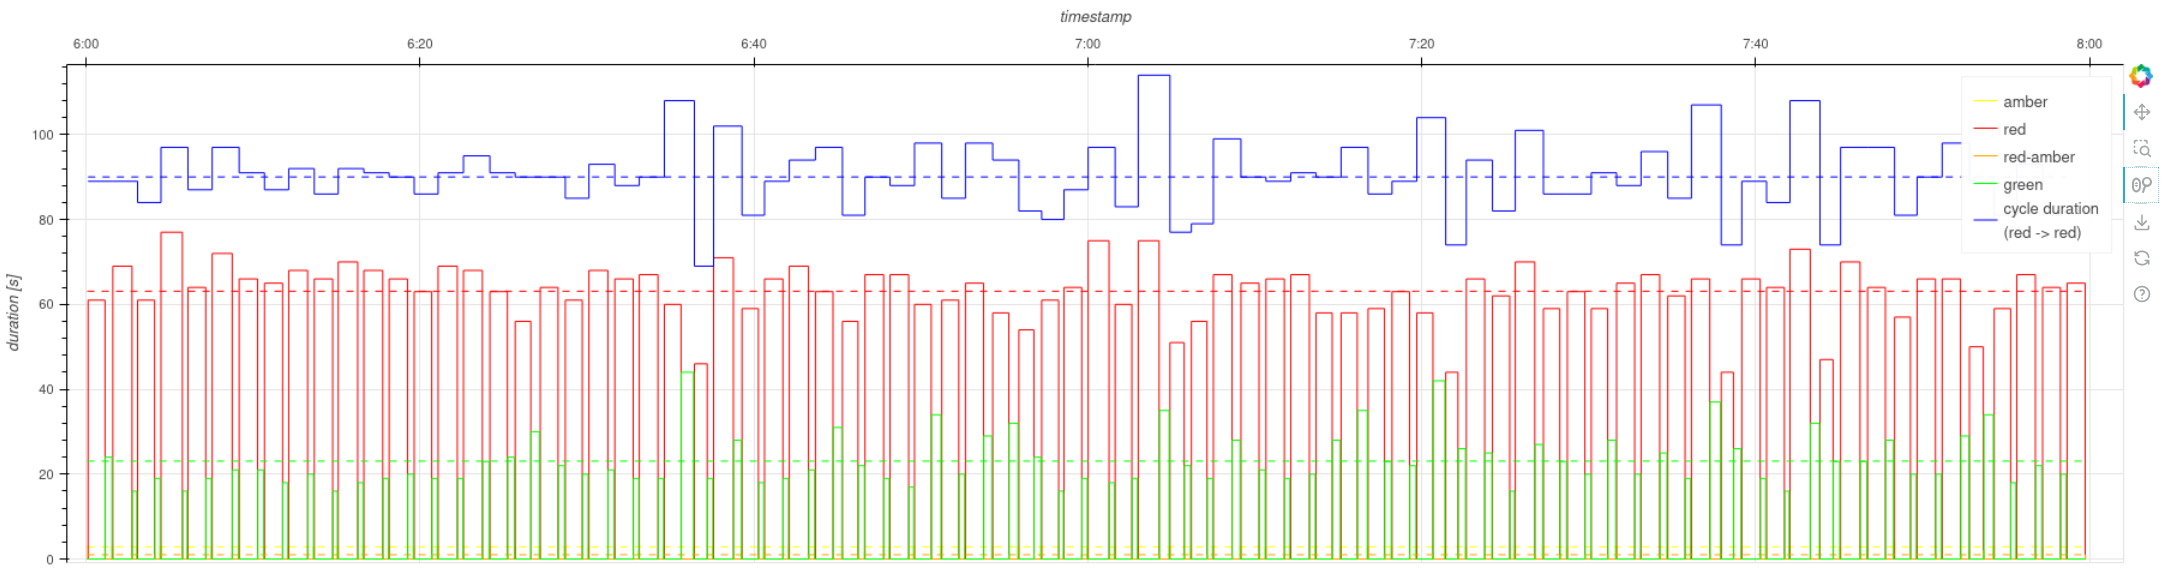
The y-axis shows the duration of a phase over time (x-axis). Blue indicates the length of complete cycles (red-to-red), and is calculated from the sum of the durations of the different phases, drawn in their corresponding colors. Dashed lines indicate average values over the time-period (arithmetic mean).
On average, a complete cycle took about 90s and the traffic-light showed red about 63s, green for about 23s, and the transitions (amber / red-amber) only account for 3s and 1s respectively.
This difference is explained by the fact that the analyzed traffic-light is pointing towards the lanes going from south to north, while the majority of (car-)traffic at that time can be expected to go from west to east towards the city center.
The observations show a number of larger deviations from the mean, with green phases being almost twice as long as normal (over 40s, at 06:30 and 07:20), followed by accordingly shorter red phases (only slightly longer than 40s).
These deviations can be explained by the dynamic traffic-lights control, which may extend certain phase durations e.g. to account for bus signal requests (bus priorization), or when detecting extraordinarily high volumes of car traffic going into a specific direction.
According to a sample of observations, recent data is online available via the API in about 1-2s after a signal phase change.
In addition to the described real-time traffic-light data for car signals, the API also provides further information e.g. on car detectors, bus signal requests, pedestrian signals, and pedestrian signal requests.
Proof-of-Concept: A simple GLOSA web-app
The app allows a mobile web-client to request speed recommendations:
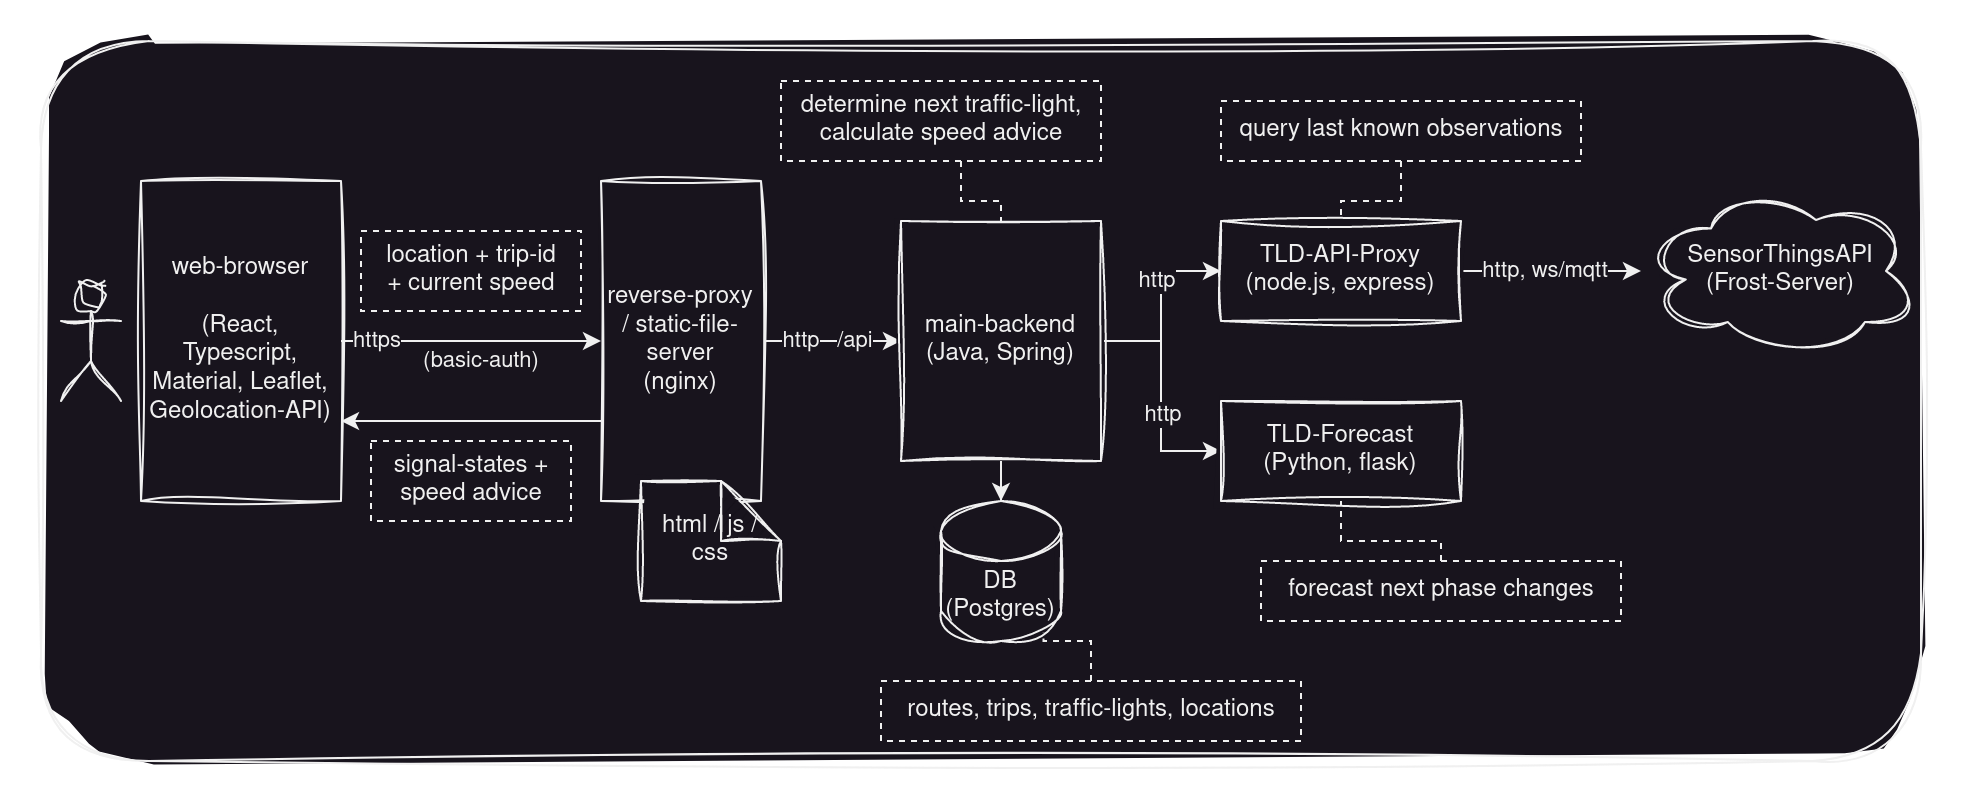
Main flow of information:
- a client requests a speed-advice, submitting its current location, movement speed, and trip-id
- based on the trip-id the server can lookup the predefined route and determine the next upcoming traffic-light
- the latest signal-phase change times can be queried from the traffic-lights-data API
- based on the received observations, a forecast of future phase changes can be created
- the forecast is used to determine the movement speed necessary to catch the next reachable green phase and that information is returned to the client
- whenever the client location updates, a new GLOSA-request is sent (see step 1., limited to at most 1 request per second)
For the proof-of-concept, the initial route configuration is done manually by importing a defined route (.gpx format), and by identifying relevant traffic-light IDs with help of the geo-portal.
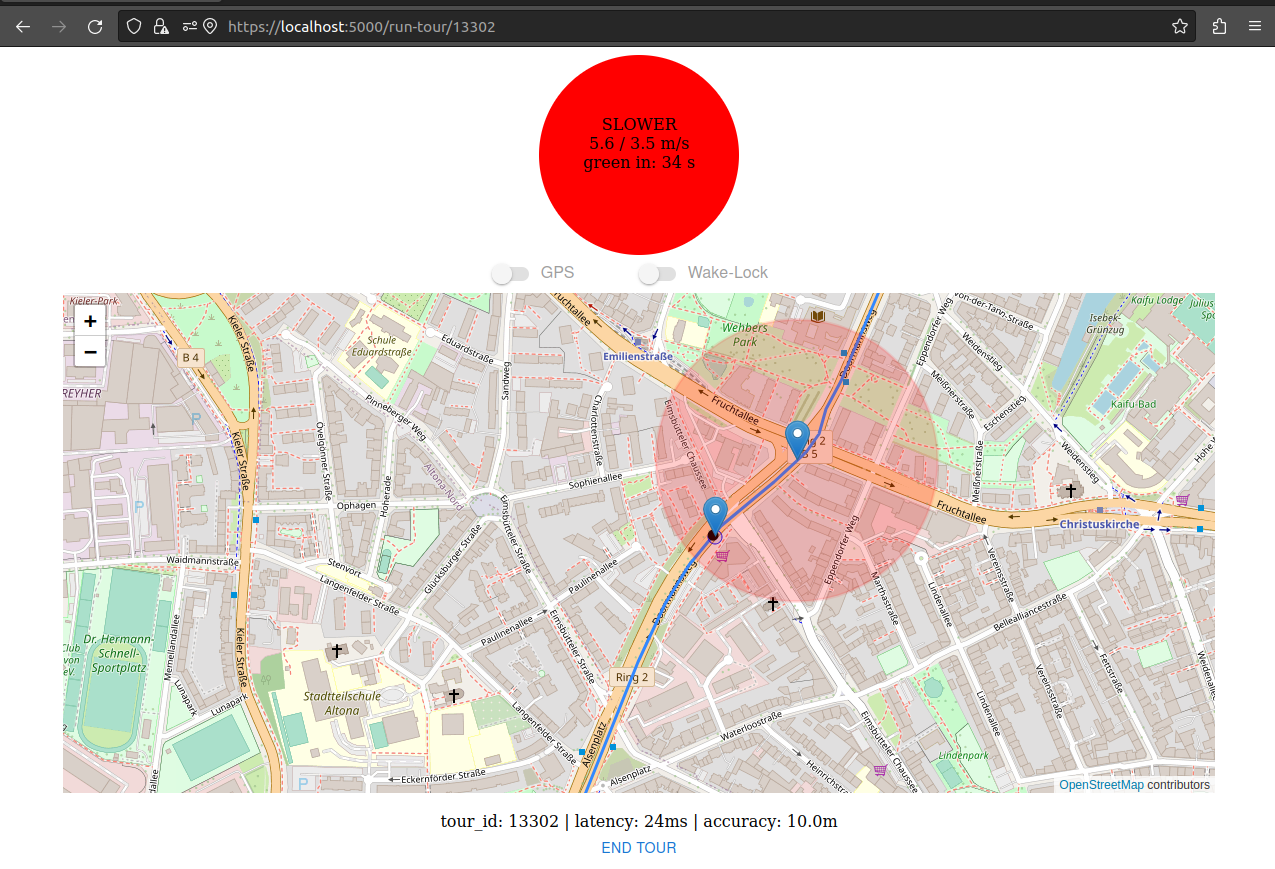
The next screenshot shows a minimal web UI which provides information about the current location of the device, the next traffic-light (currently showing red), as well as the speed recomendation (“slow down, its not getting green anytime soon..”):
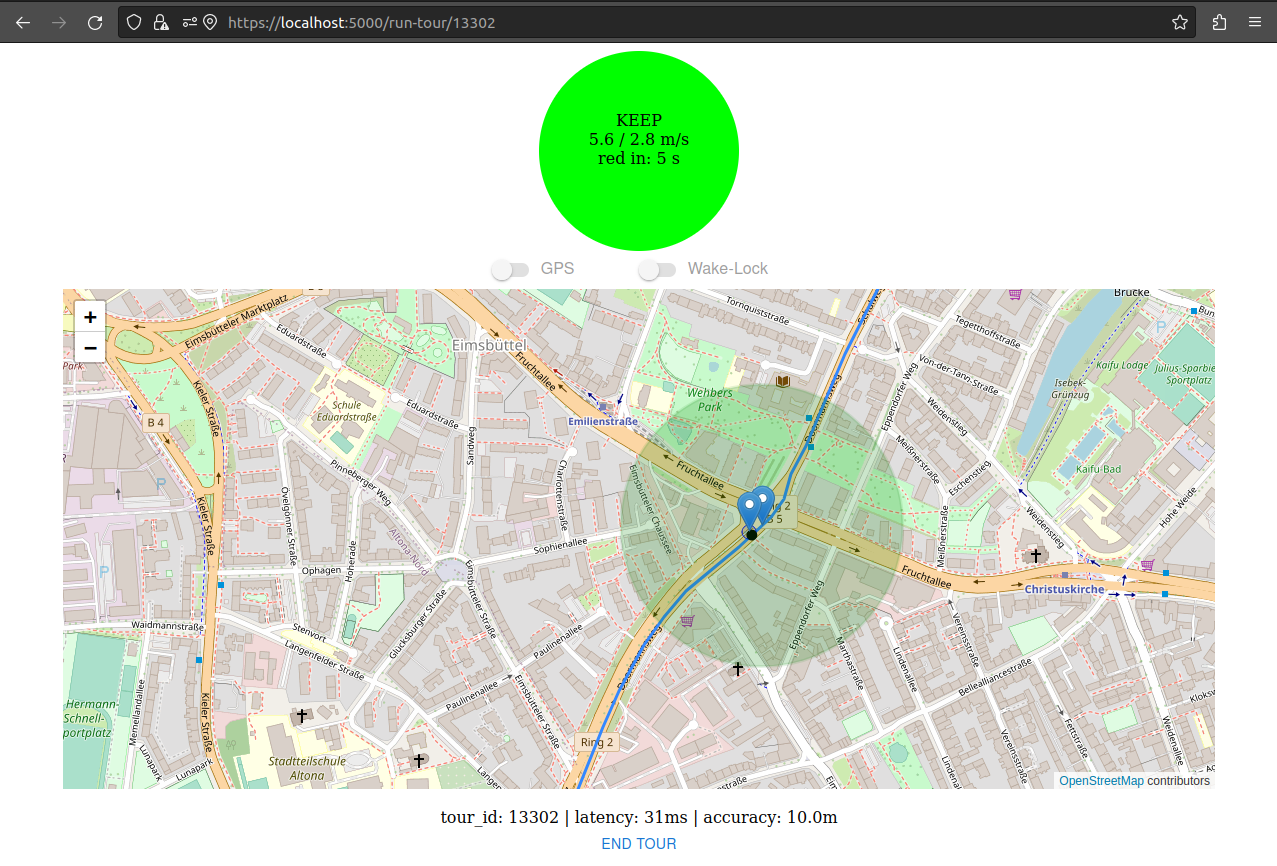
After slowing down, the signal switched to green a few seconds later, and the current speed is now sufficient to catch the phase:
Manual testing (speed set to 20 km/h):
Used technologies
Client built with React Material UI components, react-router, Leaflet for map display and interaction (via react-leaflet), and the browser Geolocation API (consent and secure context required).
Since the Geolocation API does not work in the background a wakelock can be requested.
Server-side: nginx for basic authentication, ssl-termination, static frontend file serving, and /api-request forwarding.
A “main backend service” is used for central calculations and the “orchestration” of auxiliary services, built with Spring Boot (which recently released the amazing support for compiling to a native-image, even though some stumbling blocks remain).
Access to the latest traffic-light data using express running on node.js.
Future phase change times are forecasted based on the (naive) expectation of average-length phases, implemented in Python with pandas and exposed via flask.
For simple testing during development, the public localtunnel service can be used.
(The repository is available on github).
Performance considerations
As the sketched system relies on frequent client-server-communication (~1 request per client per second), performant request handling is important.
For an analysis of server-side request processing, the open telemetry project provides standard tooling to gather tracing information for nested requests to different backend services (database, traffic-lights data API, forecasting service).
Instrumentation support for automatic trace collection and forwarding to a tracing analysis backend are available for many popular languages / frameworks. For the main Java service, the Java instrumentation agent is used, which injects bytecode so that tracing information is automatically collected for popular frameworks / libraries without any code changes. Similar auto-instrumentation functionality is available for the node.js based traffic-lights data API proxy service, and for the Python-based forecast-service.
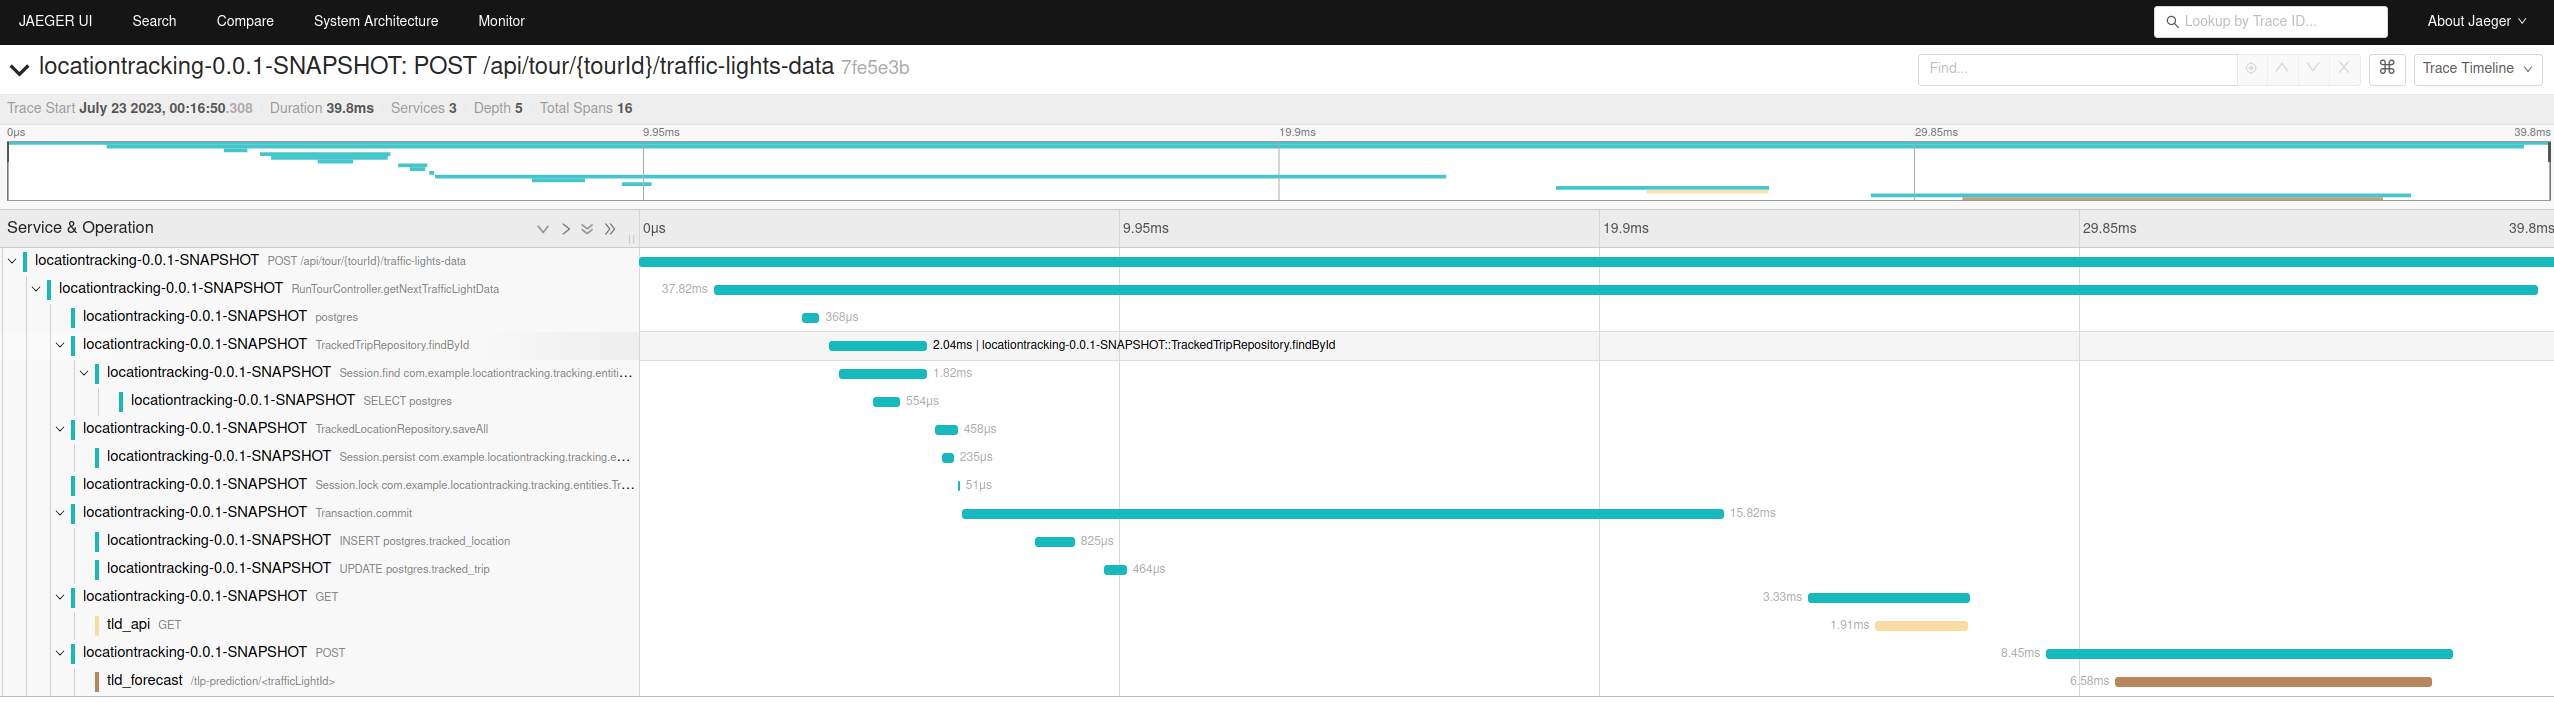
Processing of a single GLOSA-request:
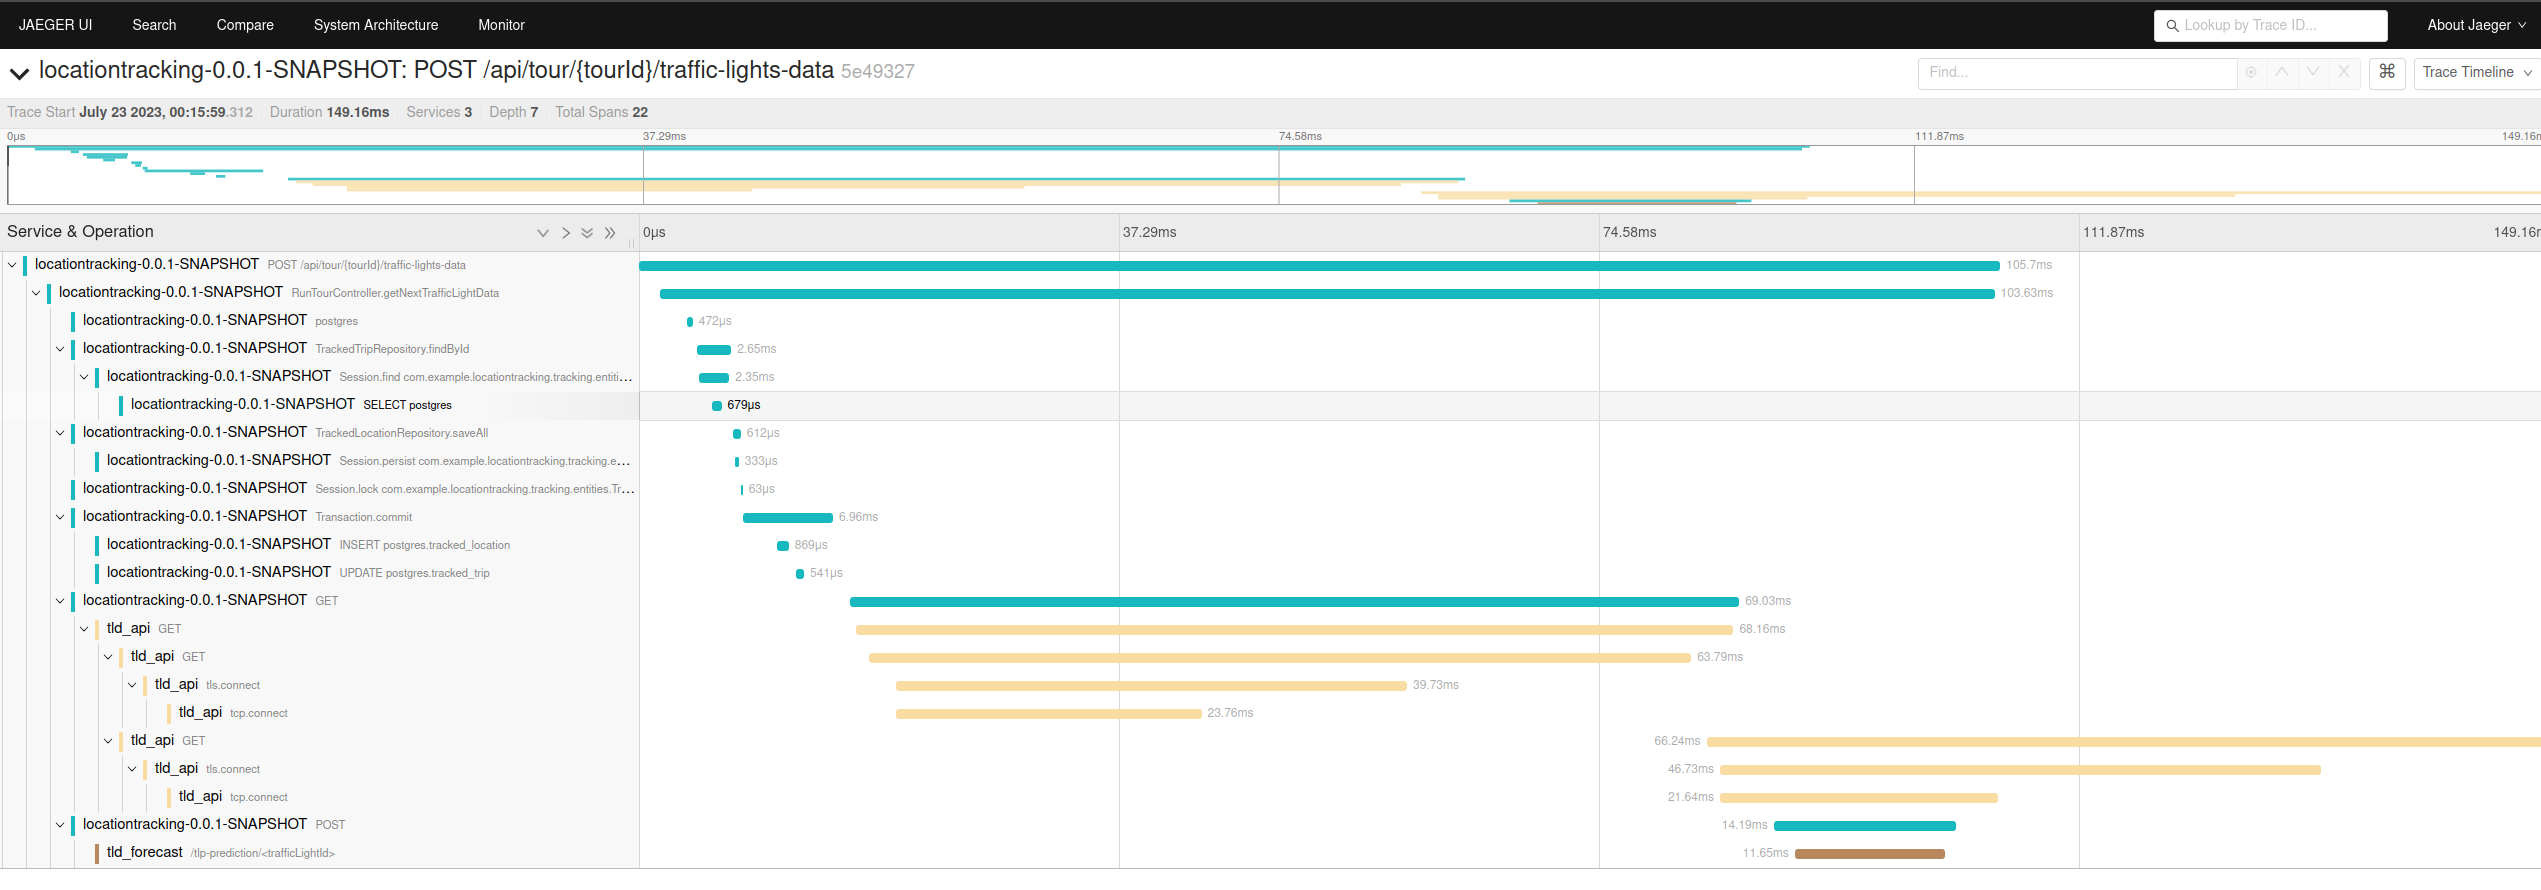
The complete POST to the main backend (locationtracking-0.0.1-SNAPSHOT) takes 105ms to complete, starting with a database accesses (first ~10ms), followed by a long-running 69ms call to the traffic-lights data API proxy service (tld_api), and a 14ms call to the forecasting service (tld_forecast). The main share of the overall request processing time is caused by the call to the external traffic-lights data API (68ms), out of which creating the TCP connection and completing the TLS handshake alone require 39ms.
To improve performance and efficiency of the external data API access, the subscription feature of the sensorthings API is used. Apart from the normal HTTP-API to access historical data of traffic-light signal phase changes, a (websocket-based) MQTT-API allows to subscribe to new updates of specific traffic-lights.
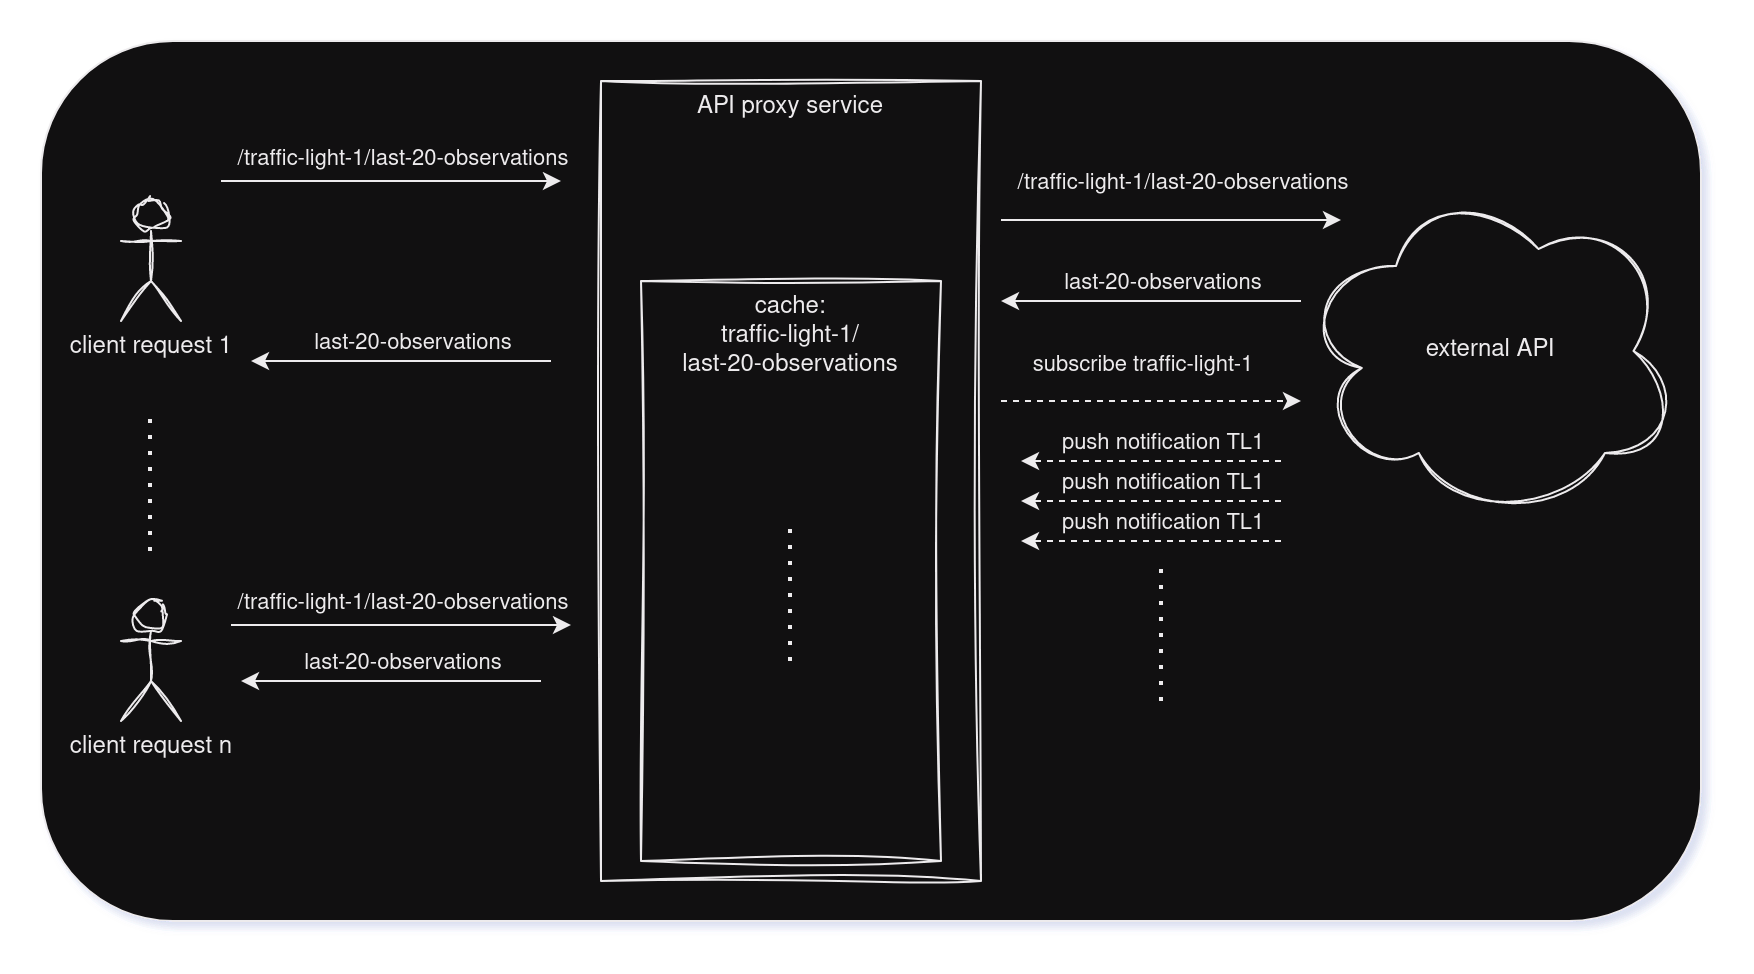
- an initial request of the last N signal phase change timestamps causes a regular HTTP request to the external API to fetch the required observations
- furthermore, the received data is cached, and an MQTT-subscription for future updates is created
- each received update is used to update the cache (evicting the oldest entry)
- each following client-request for the same traffic-light data can now immediately be answered with locally cached data, without causing any external API request
- after a configurable time without any client requests for data of a specific traffic-light (e.g. 60s), its subscription is canceled and its cache is cleared (a following client request is again causing an initial external request (1.))
The following screenshot shows the processing of a subsequent client request for the same traffic-light data:
The request to the tld_api is processed within 3ms without any external call.
To reduce the calculation effort of the route snapping, the index of the last reached route-segment is submitted back to the client as part of the response, and the information is included into the following request. This way, the number of checked route-segments can be limited (based on the assumption that a client is not expected to move backwards on a route).
Experimental evaluation
To quantify the effects of using the GLOSA app, the geolocation and speed data is sent with each request was persisted for analysis.
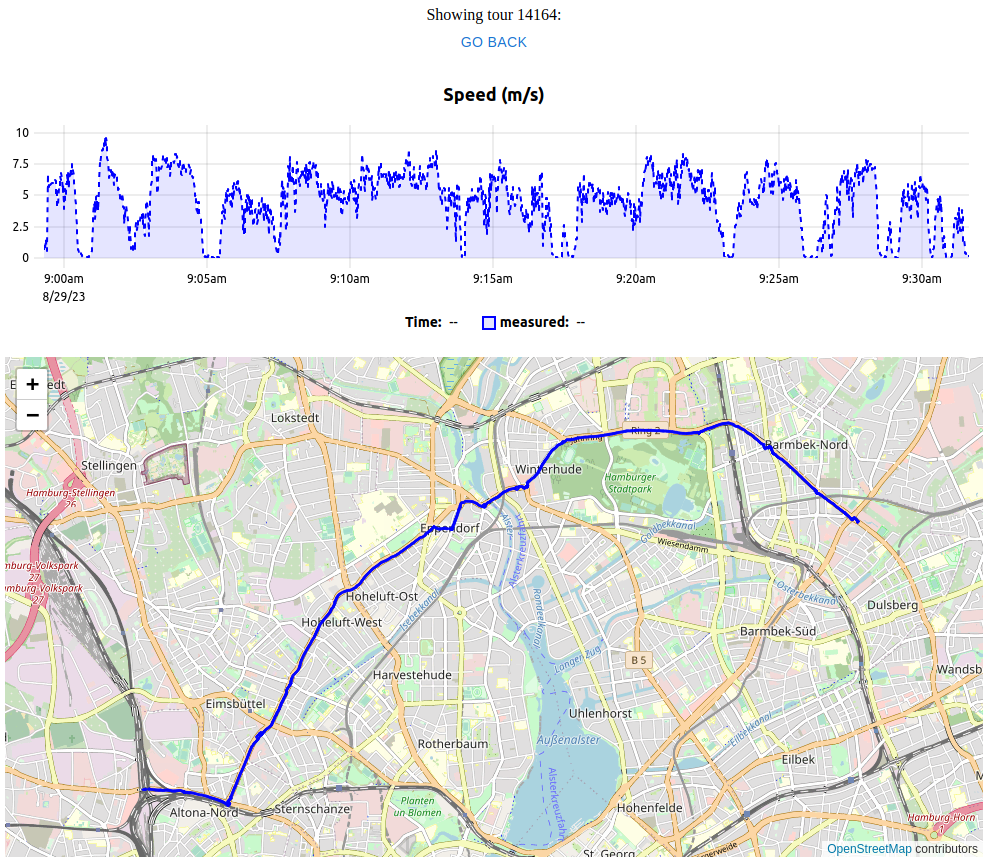
Speed profile of a bike ride without GLOSA speed recommendations:
The trip had a duration of 00:32:16, and during this time 1,937 samples were collected (one GPS update per second).
The theoretical distance measured on a map is 10.7 km, the total sum of the distances between all sampled locations is 11.1 km (slightly longer, probably due to GPS inaccuracies and seemingly “less straight” movements).
The average speed was 5.53 m/s (19.90 km/h).
This is close to the average speed calculated from the 1,937 speed samples (5.38 m/s), so the measurements seem to be quite accurate.
The maximum measured speed was 9.30 m/s (33.47 km/h), the share of samples with a measured speed below 1 km/h (likely stops) was 10.8%.
Trip with GLOSA recommendations:
The share of speed measurements below 1 km/h is still 9.2% - a difference of 1.6 percentage points which may not be interpreted to be of any significance.
An extended evaluation should be based on a larger number of trips. (Furthermore, the experiment itself was probably also negatively influenced by existing experience on the typical phase lengths.)
The effect of using the GLOSA app is negatively influenced by:
- outdated traffic light data for some traffic lights (the “real-time” data is so old that no meaningful predications can be made)
- badly correlated traffic lights (no matter how slow/quick you try to go, between some traffic lights stops are almost inevitable; the phases seem to be optimized for a limited number of cars driving 50 km/h)
- “Bedarfsampeln” (one traffic light on the route only switches to green upon manual triggering, thus also causing unavoidable stops)
- volatile phase lenghts (forecasts purely based on historical data tend to be rather inaccurate, given the dynamic, adaptive traffic control)
Especially the last point causes a particularly frustrating experience in case a green phase could actually have easily been catched when not following a recommendation.